


Bitcoin’s (BTC) drop to $58,000 has pushed the price into a zone that long-term power-law models have historically associated with cycle bottoms. The data does not confirm a bottom range, though it shows BTC trading in a price range that has repeatedly marked major lows since 2014.
Derivatives data and liquidation levels highlight $55,000 as the next key support level and the $65,000-$68,000 range as the next major upside area of interest.
Bitcoin power-law puts $58,000 in historical range
Giovanni’s Bitcoin power-law model places the network’s long-term trend price near $135,000, making the recent drop to $58,000 roughly 54% below the all-time high and 1.22 standard deviations beneath that trend.
According to the analyst, the key takeaway is straightforward: the previous cycle lows in 2012, 2015, 2019, 2020, and 2022 all fell within a similar statistical range. By that measure, the latest decline falls within a territory that has historically marked the deep bear-market lows rather than a break in Bitcoin’s long-term growth path.

Bitcoin price deviation based on the power-law trend. Source: X
The model estimates the commonly referenced “-1σ” support near $68,000, while the stronger historical floor sits closer to $55,000. Giovanni also noted that Bitcoin would need to trade below roughly $17,000 for more than a year before the power-law itself could be considered invalid.
A second metric points in the same direction. Bitcoin’s power-law quantile has fallen to 6.2%, indicating the asset is cheaper than roughly 94% of its historical observations when measured against the power-law model. The chart highlights similar readings during the 2015, 2020, and 2023 cycle lows, with the current market now revisiting that historically rare valuation zone.
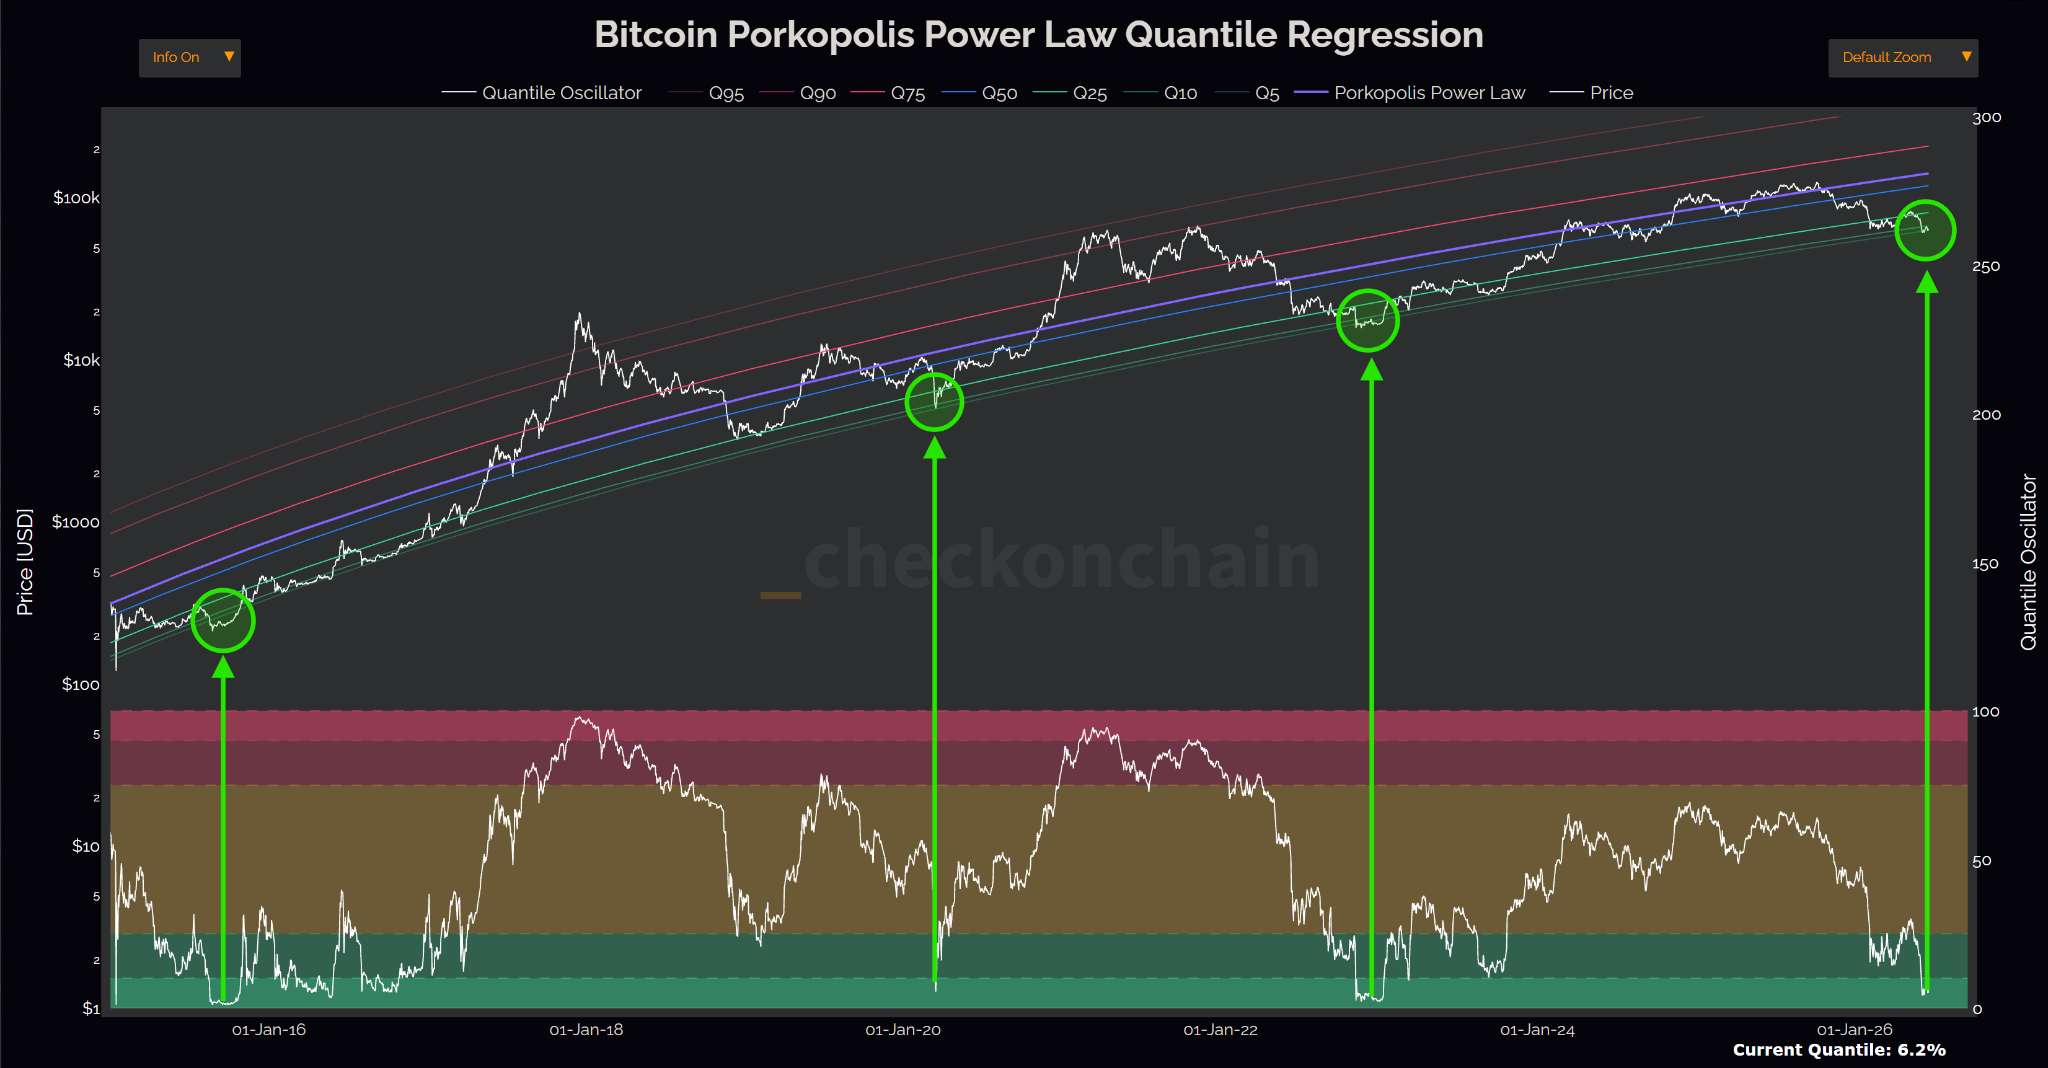
Bitcoin power-law quantile regression chart. Source: Checkonchain
Related: Bitcoin drops to $58K on high US PCE inflation as trader sees ‘manipulation’
Key BTC price levels to watch
Bitcoin fell to a new yearly low of $58,000 after aggressive selling swept through Binance. The hourly taker sell volume reached $2.1 billion, followed by another $1.9 billion in the next hour after the New York market open, marking the exchange’s largest hourly sell pressure since May 4.
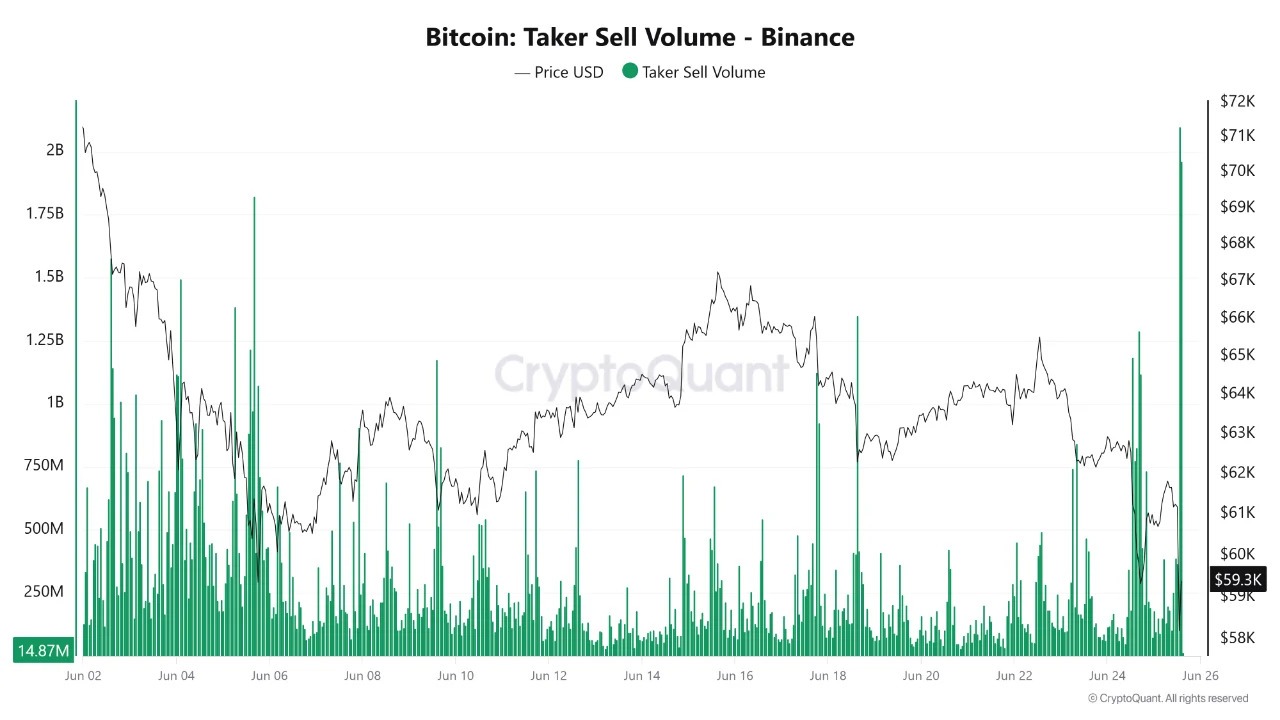
Bitcoin taker sell volume on Binance. Source: CryptoQuant
The flush liquidated more than $300 million in long BTC positions before the price rebounded toward $60,000. That level now carries added significance. A daily close back above $60,000 preserves the developing relative-strength index (RSI) bullish divergence across the one-hour, four-hour, and daily time frames which signals that selling momentum is fading even as the price prints lower lows.
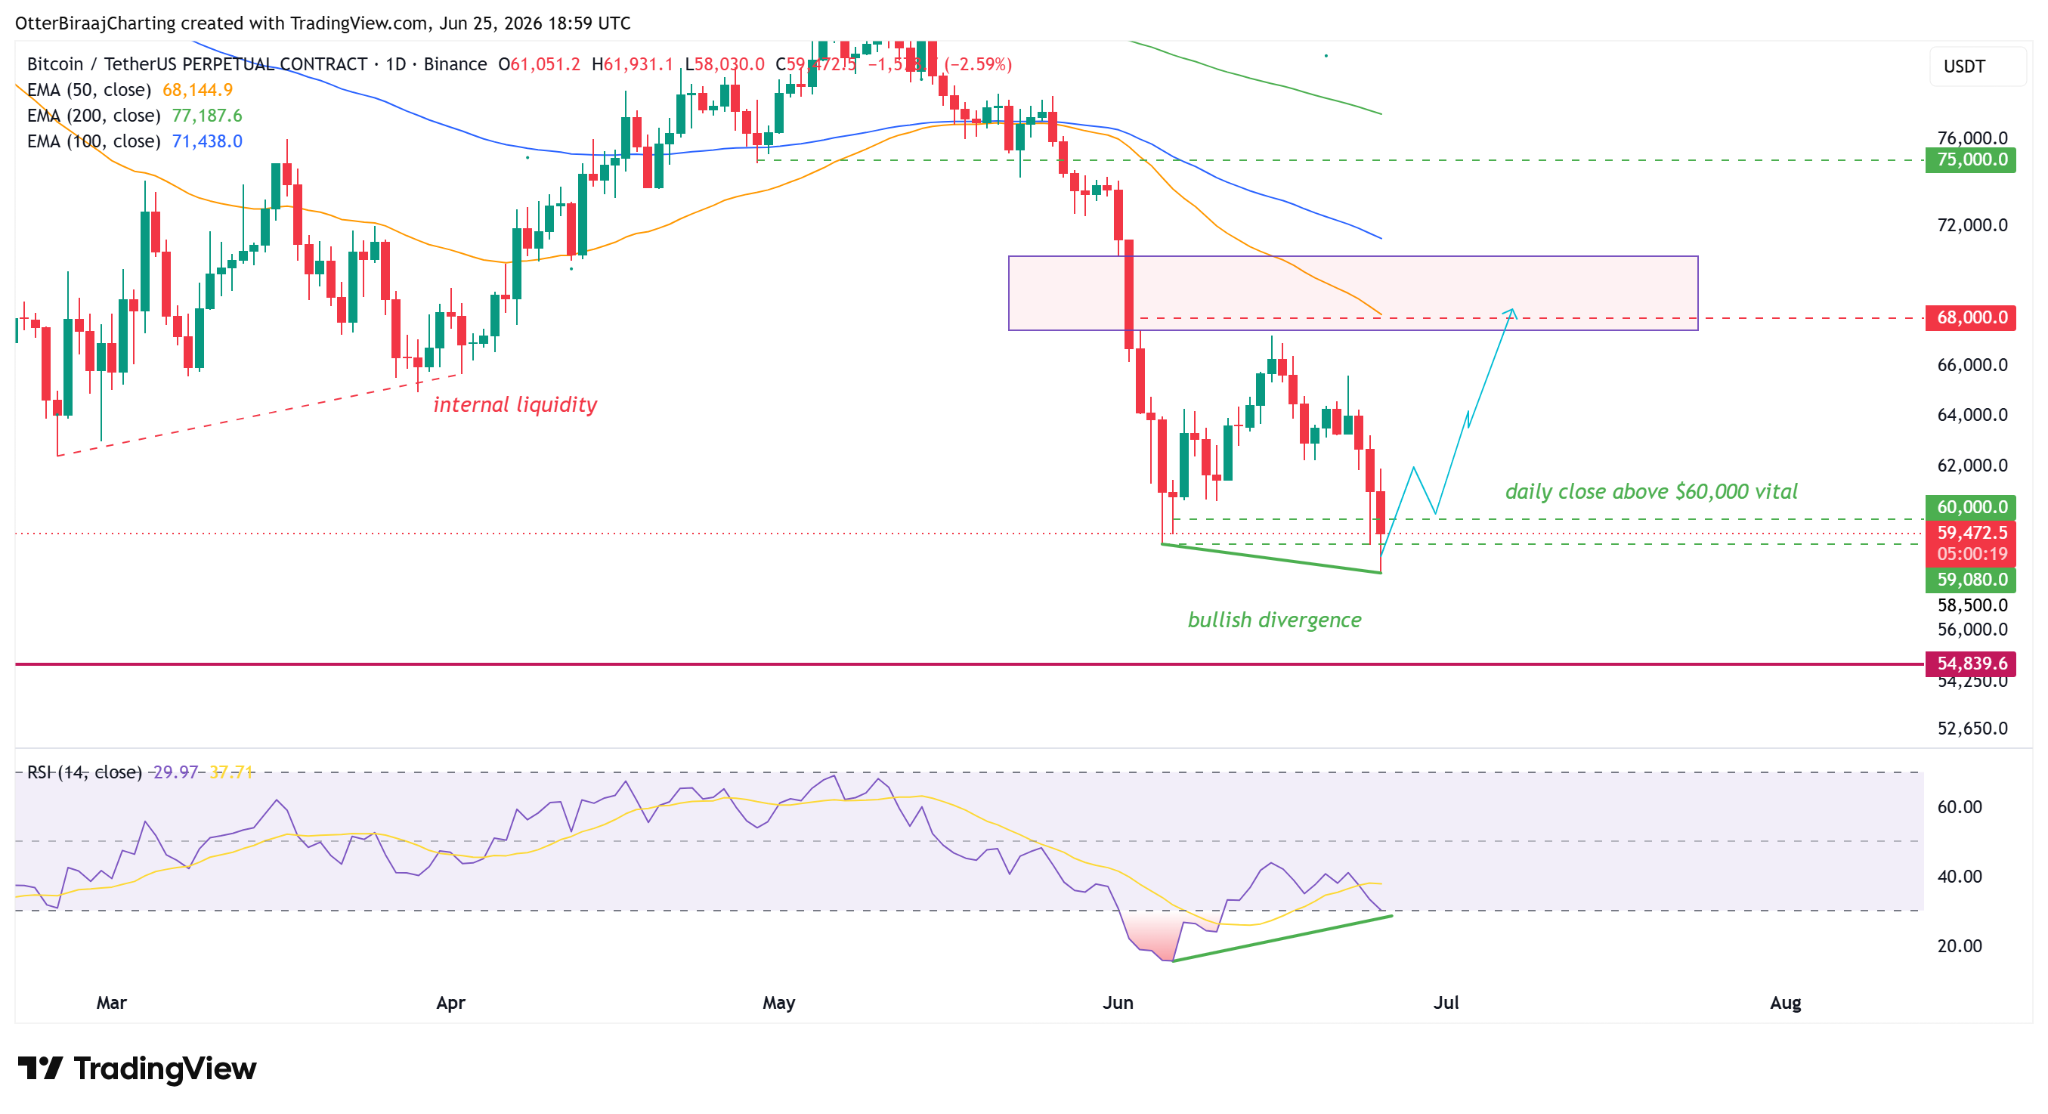
BTC/USDT, one-day chart. Source: Cointelegraph/TradingView
Futures trader Byzantine General shared a similar outlook, saying the move to $58,000 cleared out leveraged longs while drawing in fresh short sellers. In his view, a daily close above $60,000 would strengthen the case that Bitcoin has printed a local bottom for now.
That would also shift attention toward a large pocket of upside liquidity. More than $4 billion in short liquidations cluster near $65,000, compared with about $1 billion below $55,000, creating a four-to-one imbalance. A relief rally could then target internal liquidity near $68,000, where a daily fair-value gap adds another area of interest for traders.
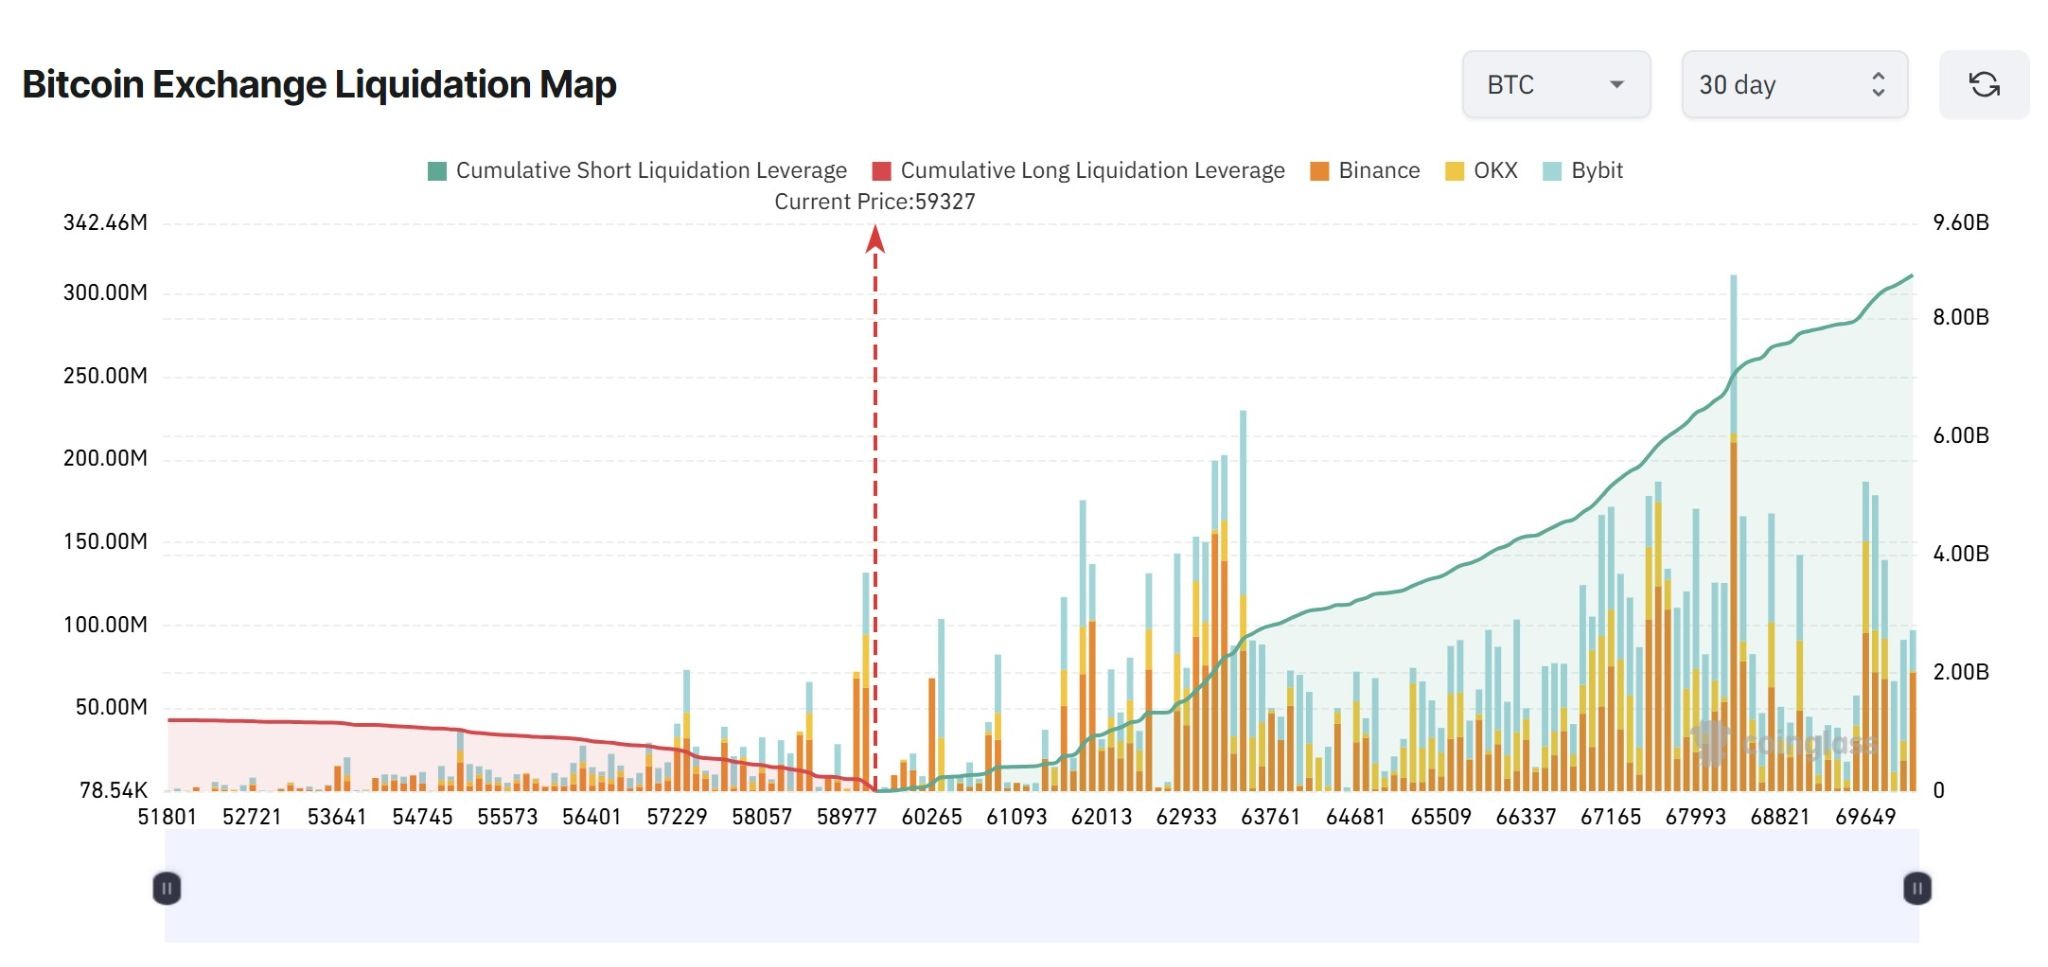
BTC liquidation map. Source: CoinGlass
Meanwhile, a daily close below $60,000 reinforces the bearish bias on both the short-term and long-term charts. The next area of interest then shifts to $55,000, where Bitcoin’s September 2024 weekly range low converges with its realized price near $54,000.
The realized price, which tracks the average cost basis of all onchain coins, has historically provided support at every major Bitcoin bear-market bottom since 2014. That trend makes the $54,000-$55,000 region a key level for traders to watch if selling pressure continues.
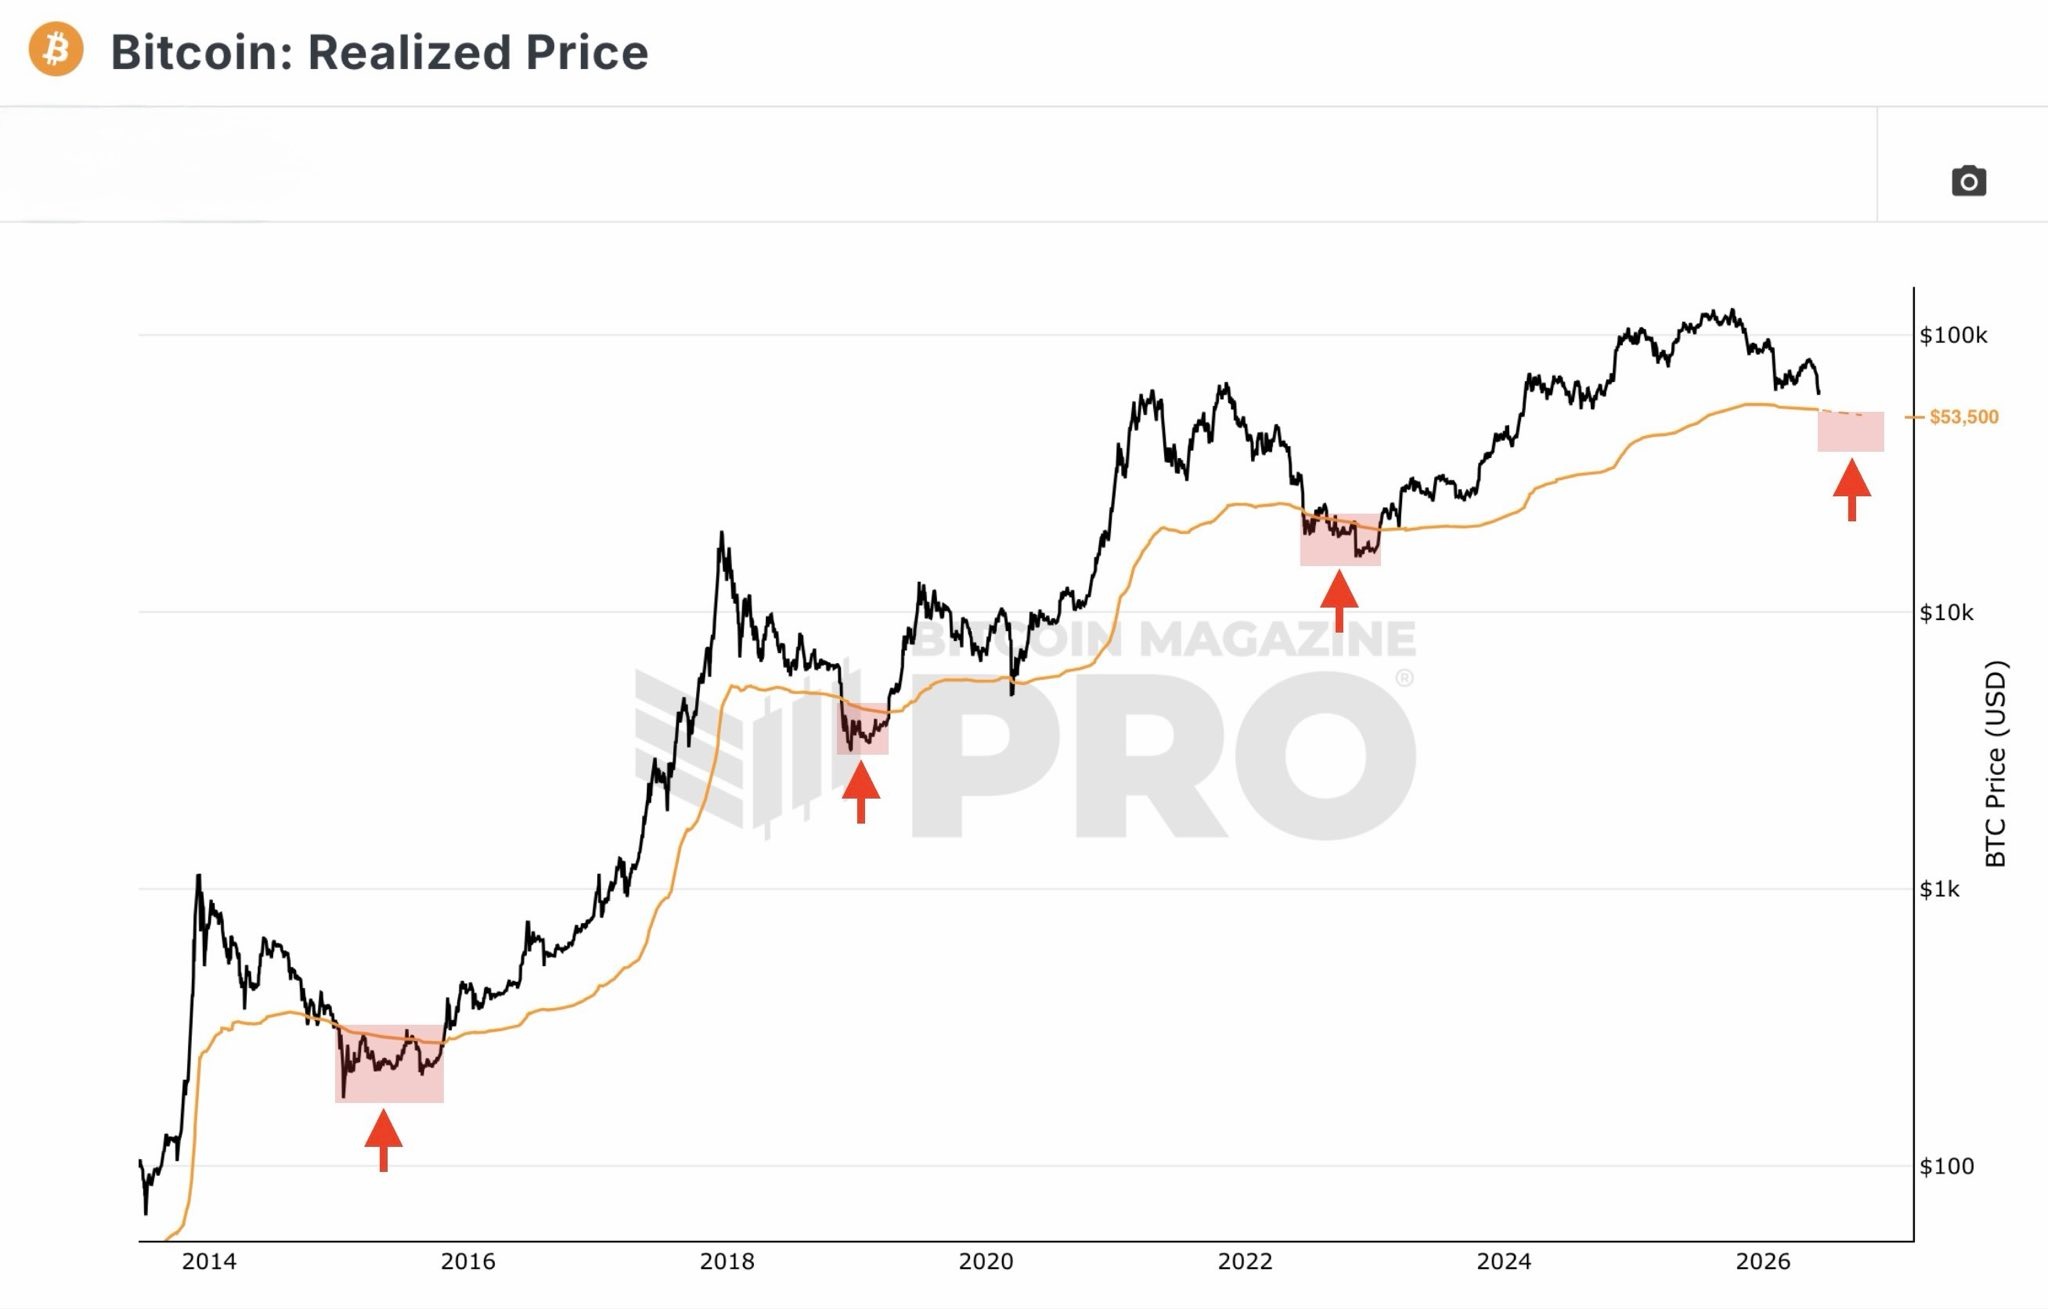
Bitcoin’s realized price. Source: X
Related: Bitcoin drop to $58K brings out bears: Is BTC’s next stop below $50K?