


Key points:
- Bitcoin has dipped below $77,000, signaling that the bears are poised to seize control.
- Altcoins are a mixed bag, with some attempting to push through the overhead resistance while others struggle to hold on to the support.
Bitcoin (BTC) has dipped below $77,000, indicating that the bears are attempting to seize control. Glassnode said the true market mean at $78,300 has historically acted as a dividing line between bear and bull market regimes. If the price breaks sharply below the level, it suggests that the recent rally may have been a “local top within the ongoing bear market.”
Institutional investors seem to be selling, as evidenced by the sharp decline in the Coinbase premium over the past few days. LVRG research director Nick Ruck told Cointelegraph that the decline of the Coinbase premium signals selling from large holders, which “could weigh on near-term price momentum across major crypto assets.”

Crypto market data daily view. Source: TradingView
What is the crucial level that suggests the bulls are back in command? Independent analyst Filbfilb said in a post on X that the previous two bear markets had ended after “a >+20% weekly candle and a break of the weekly super trend.” If the current bear trend has to fail, BTC has to rise above the super trend level at $88,000.
Could BTC and select major altcoins hold on to their strong support levels? Let’s analyze the charts of the top 10 cryptocurrencies to find out.
Bitcoin price prediction
BTC turned down at the 20-day exponential moving average ($78,280), suggesting the bears are attempting to take charge.
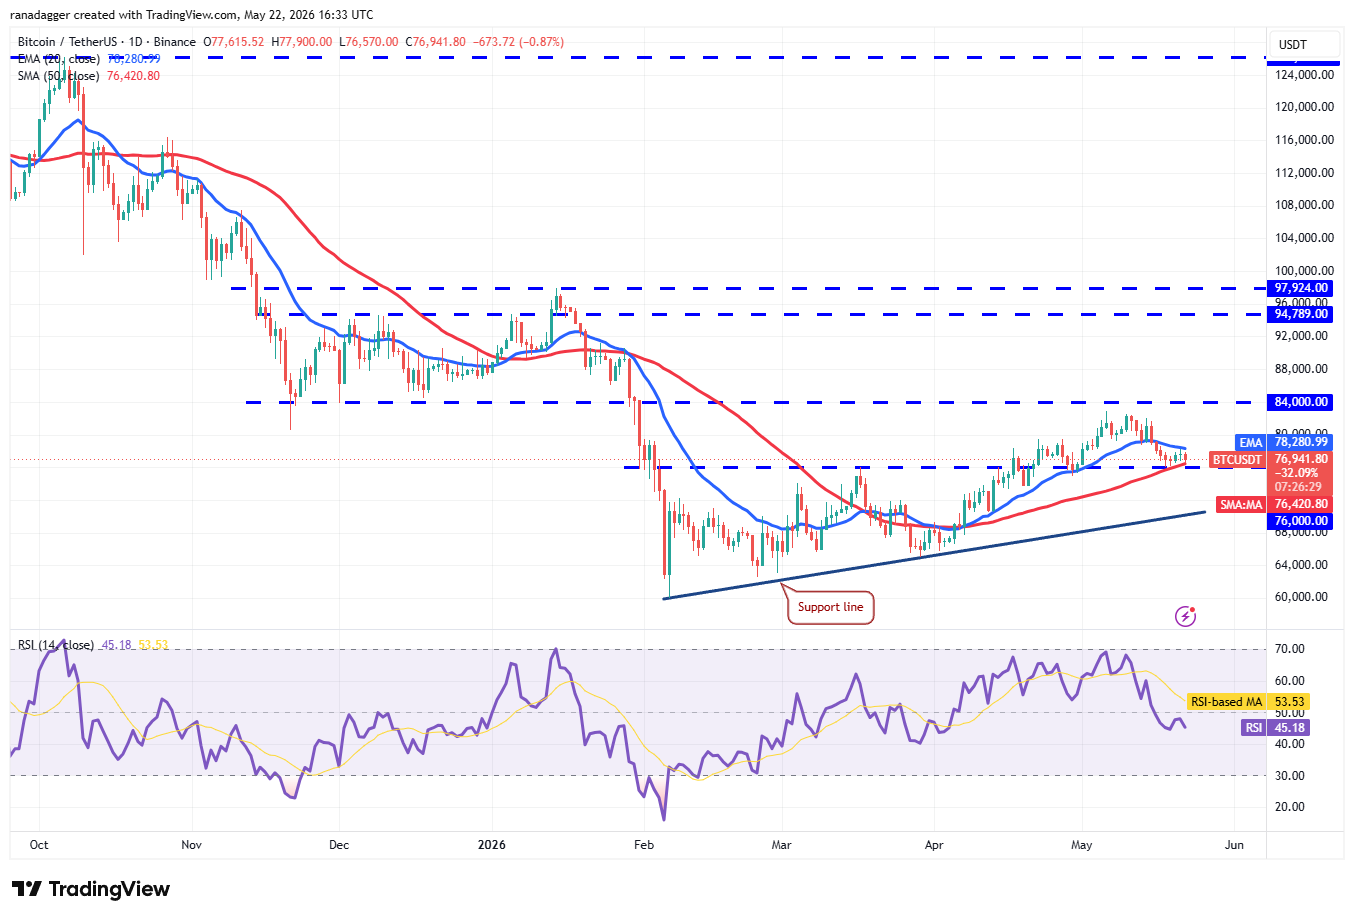
BTC/USDT daily chart. Source: Cointelegraph/TradingView
The $76,000 level is the critical support to watch on the downside, as a close below it would signal an advantage to the bears. That increases the risk of a drop to the support line, which is likely to attract buyers.
Time is running out for the bulls. They will have to push and maintain the BTC price above the 20-day EMA to gain the upper hand. If they do that, the BTC/USDT pair may begin its journey toward $82,000 and eventually reach the crucial $84,000 level.
Ether price prediction
Sellers are attempting to retain Ether (ETH) below the support line, but the bulls have kept up the pressure.
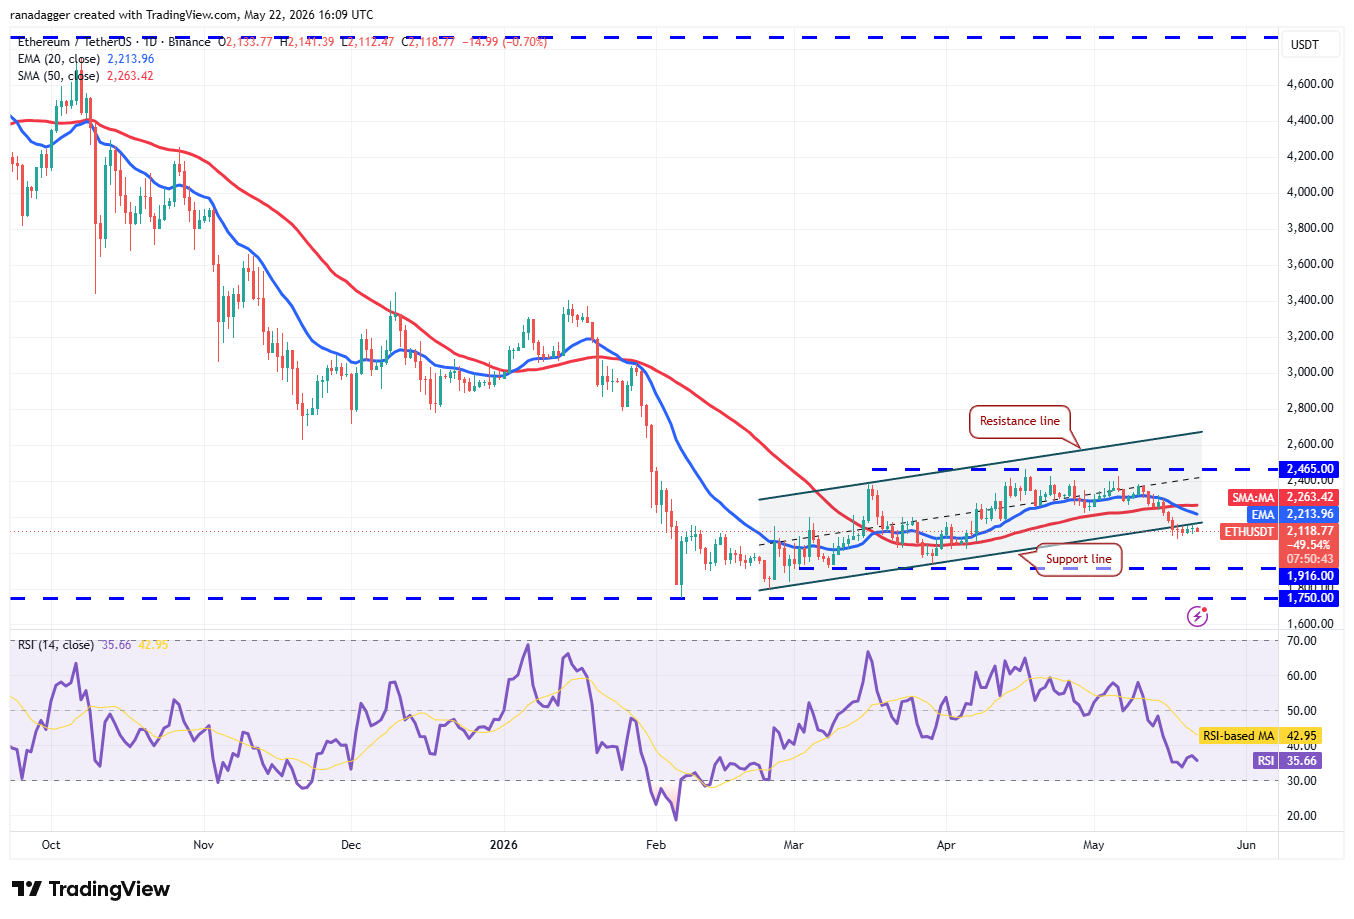
ETH/USDT daily chart. Source: Cointelegraph/TradingView
The bulls will have to drive the ETH price above the moving averages to signal a comeback. If they do that, it suggests that the break below the support line may have been a bear trap. The ETH/USDT pair may climb to $2,465 and then to the resistance line of the ascending channel pattern.
Contrary to this assumption, if the price declines from the current level or the 20-day EMA and breaks below $2,077, it would signal that the bears remain in control. That may sink the pair to the $1,916 support.
BNB price prediction
BNB (BNB) rose above the 20-day EMA ($650) on Wednesday, and the bulls are attempting to push the price to $687.
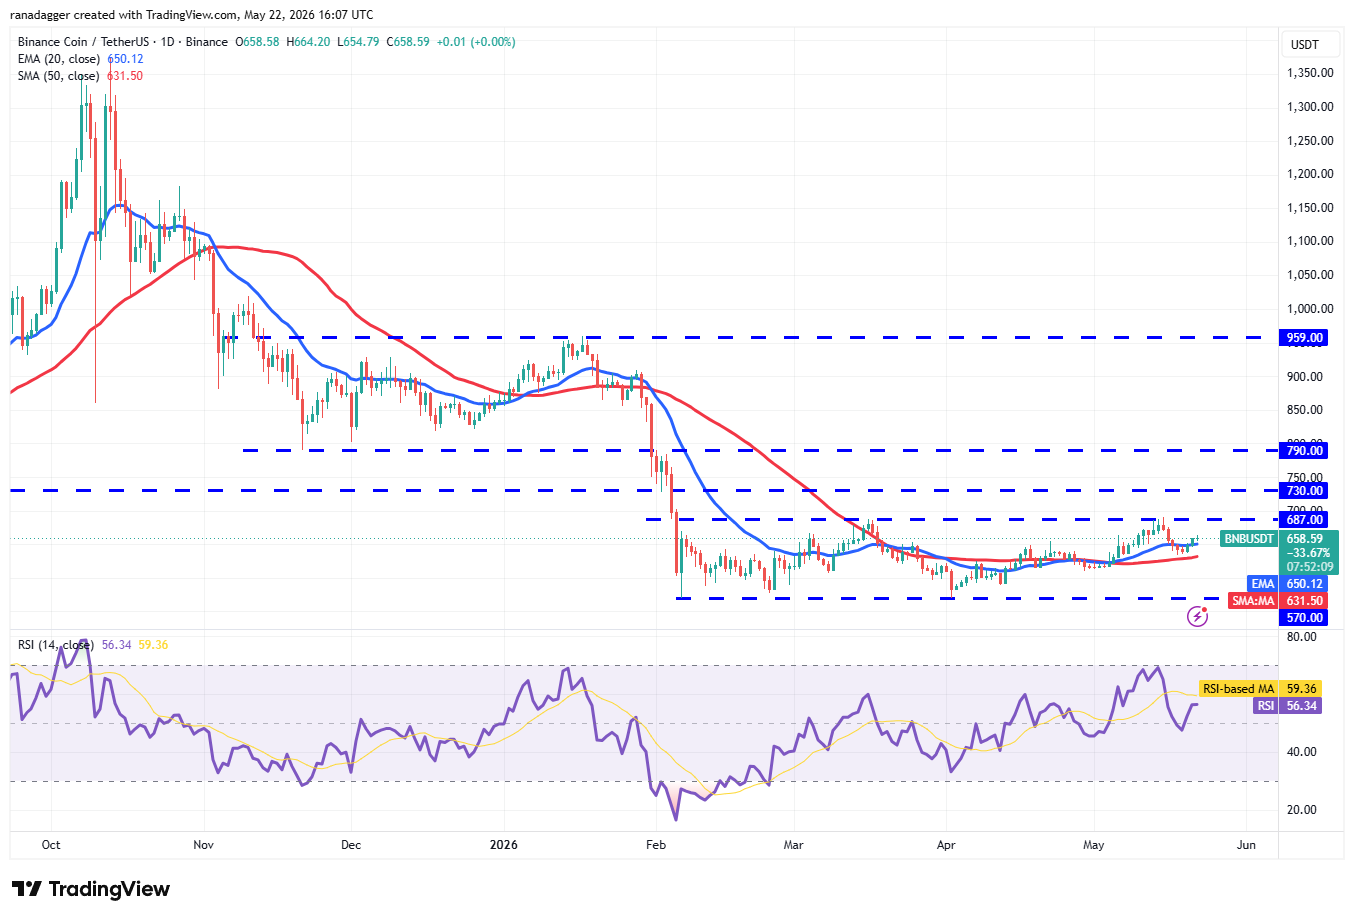
BNB/USDT daily chart. Source: Cointelegraph/TradingView
Sellers will attempt to defend the $687 resistance, but if the bulls prevail, the BNB/USDT pair may march toward $730 and then $790. Such a move suggests that the pair may have bottomed out at $570.
The bears are likely to have other plans. They will attempt to defend the overhead resistance and pull the BNB price below the 50-day simple moving average ($631). If they succeed, the pair may extend its stay within the $570 to $687 range for a while longer.
XRP price prediction
XRP (XRP) remains below the moving averages, indicating that the bears are in no mood to let go of their advantage.
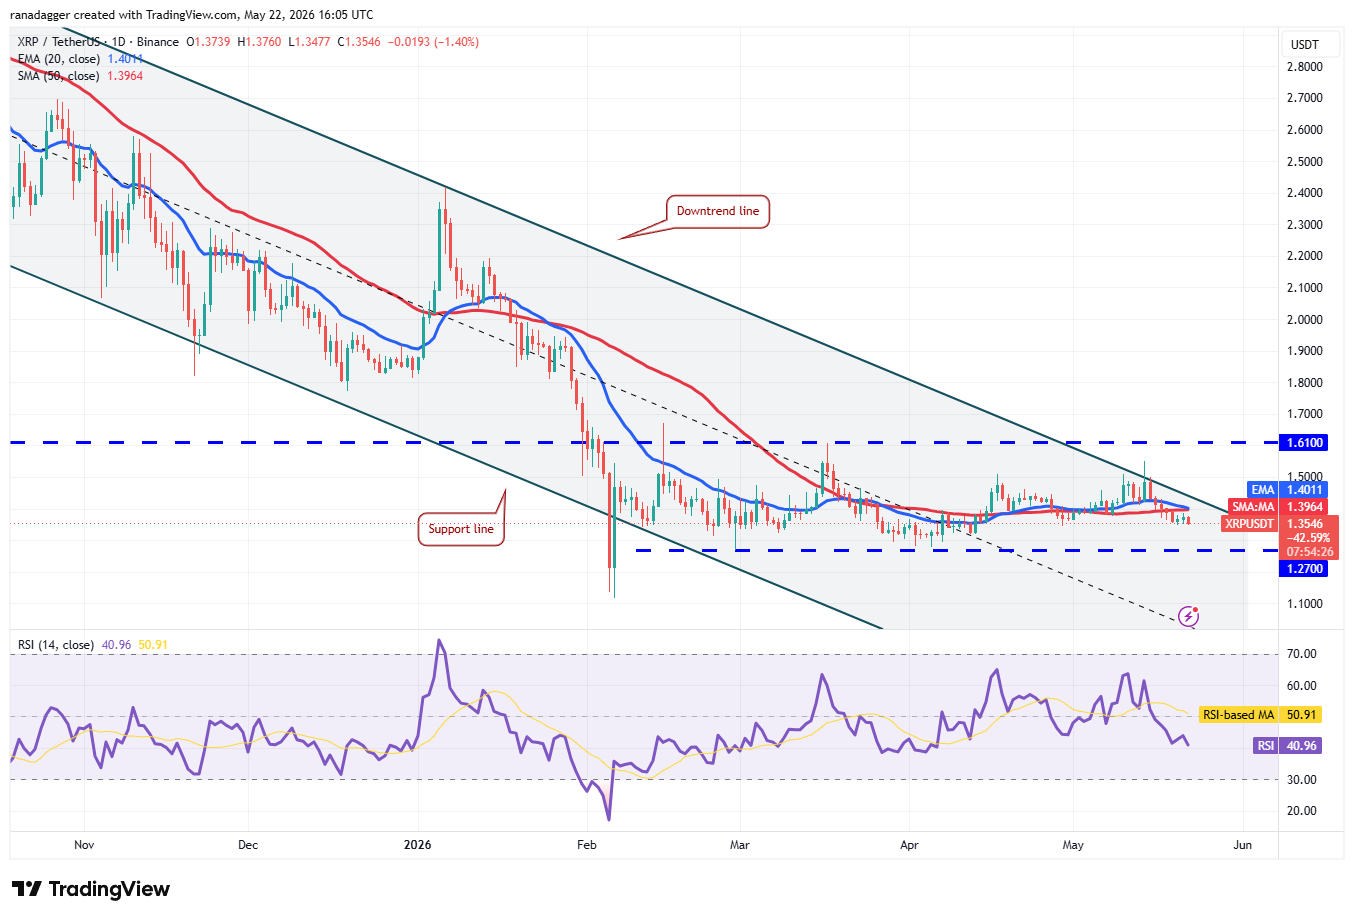
XRP/USDT daily chart. Source: Cointelegraph/TradingView
Sellers will attempt to strengthen their position by pushing the XRP price below the $1.27 support level. If they manage to do so, the XRP/USDT pair may plummet to $1.11, where buyers are expected to step in.
The first sign of strength will be a close above the downtrend line. The pair may then ascend to $1.61, a crucial level to watch. If buyers overcome the barrier, the pair may surge toward $2.40.
Solana price prediction
Solana’s (SOL) relief rally reached the 20-day EMA ($87.83), where the bears are expected to pose a strong challenge.
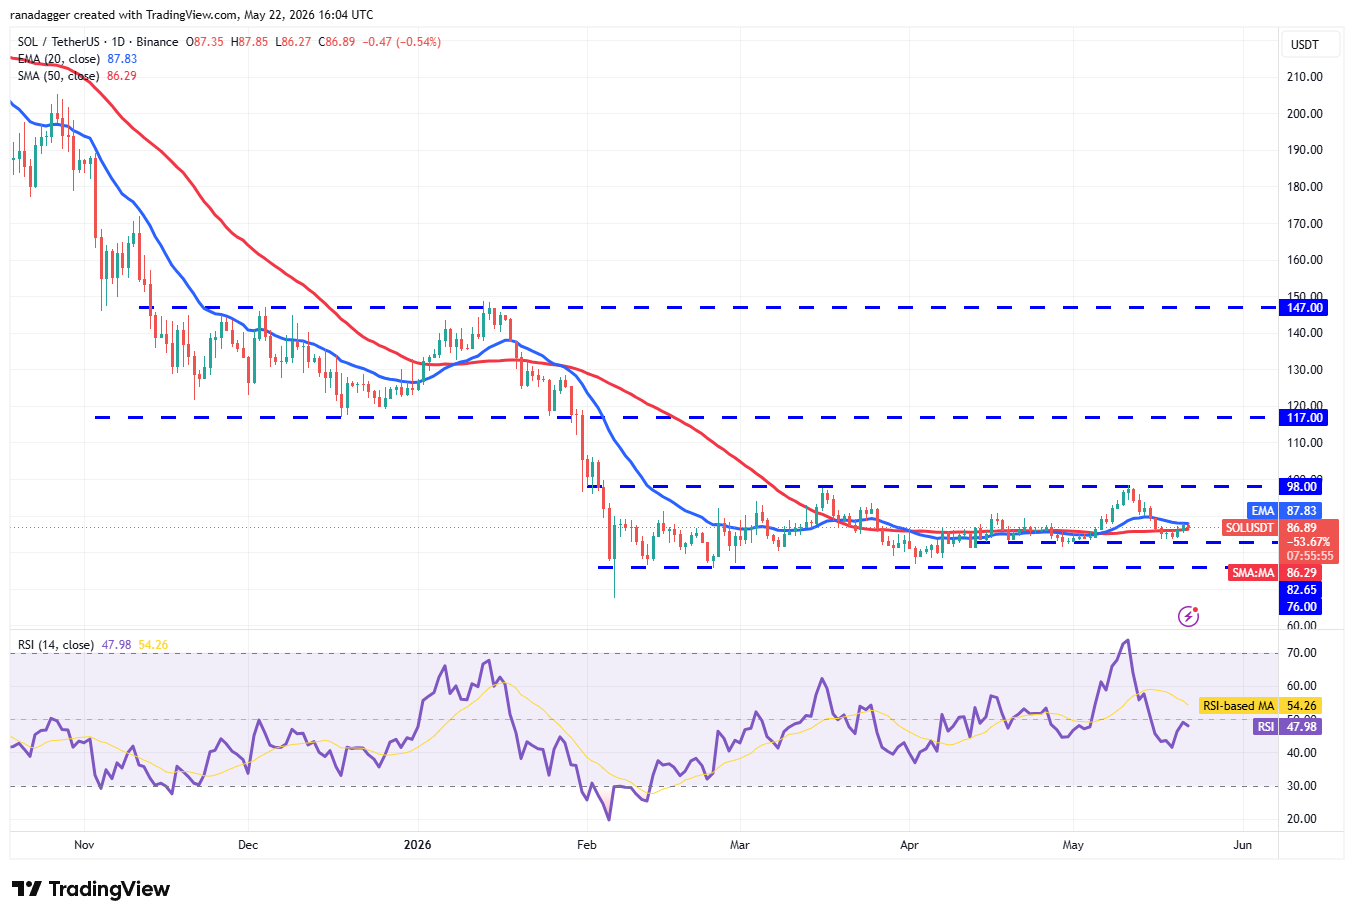
SOL/USDT daily chart. Source: Cointelegraph/TradingView
If buyers propel the SOL price above the 20-day EMA, it suggests demand at lower levels. The SOL/USDT pair may then climb to the $98 overhead resistance. A close above $98 signals the start of a new up move toward $117.
On the contrary, if the price declines sharply from the 20-day EMA and breaks below $82.65, it suggests the bears remain in control. The pair may then tumble to the $76 support.
Dogecoin price prediction
Dogecoin (DOGE) turned up from the 50-day SMA ($0.10) on Wednesday, but the relief rally is facing resistance at the 20-day EMA ($0.11).
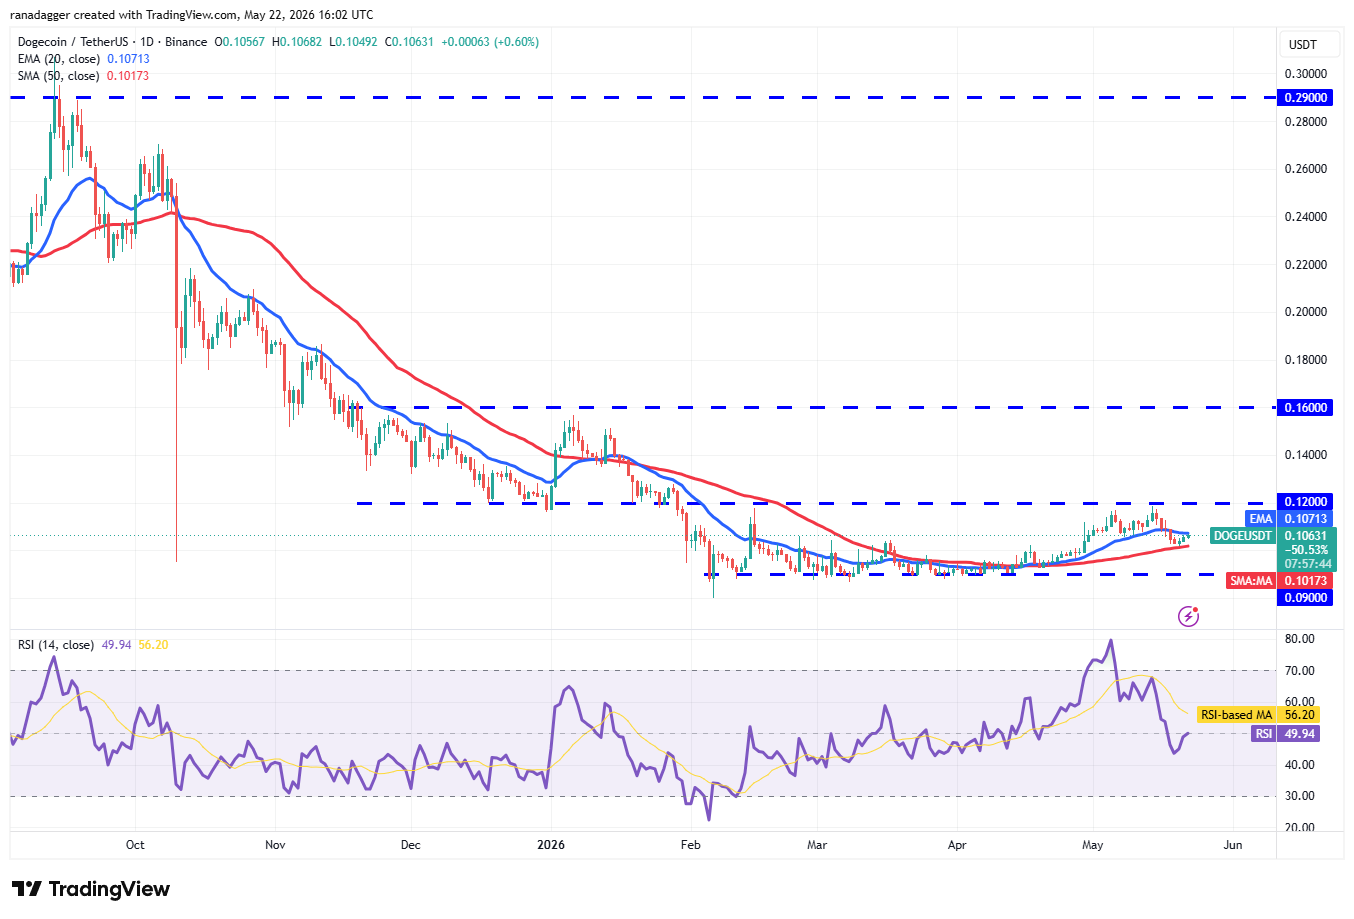
DOGE/USDT daily chart. Source: Cointelegraph/TradingView
If buyers pierce the 20-day EMA, the DOGE/USDT pair may rise to the $0.12 overhead resistance. Sellers are expected to defend the $0.12 level, as a close above it would signal a short-term trend change. The DOGE price may then soar to $0.14 and later to $0.16.
The 50-day SMA is the critical support to watch on the downside, as a break below it could sink the pair to the $0.09 level.
Hyperliquid price prediction
Hyperliquid (HYPE) continued its uptrend, skyrocketing to a new all-time high of $62.65 on Thursday.
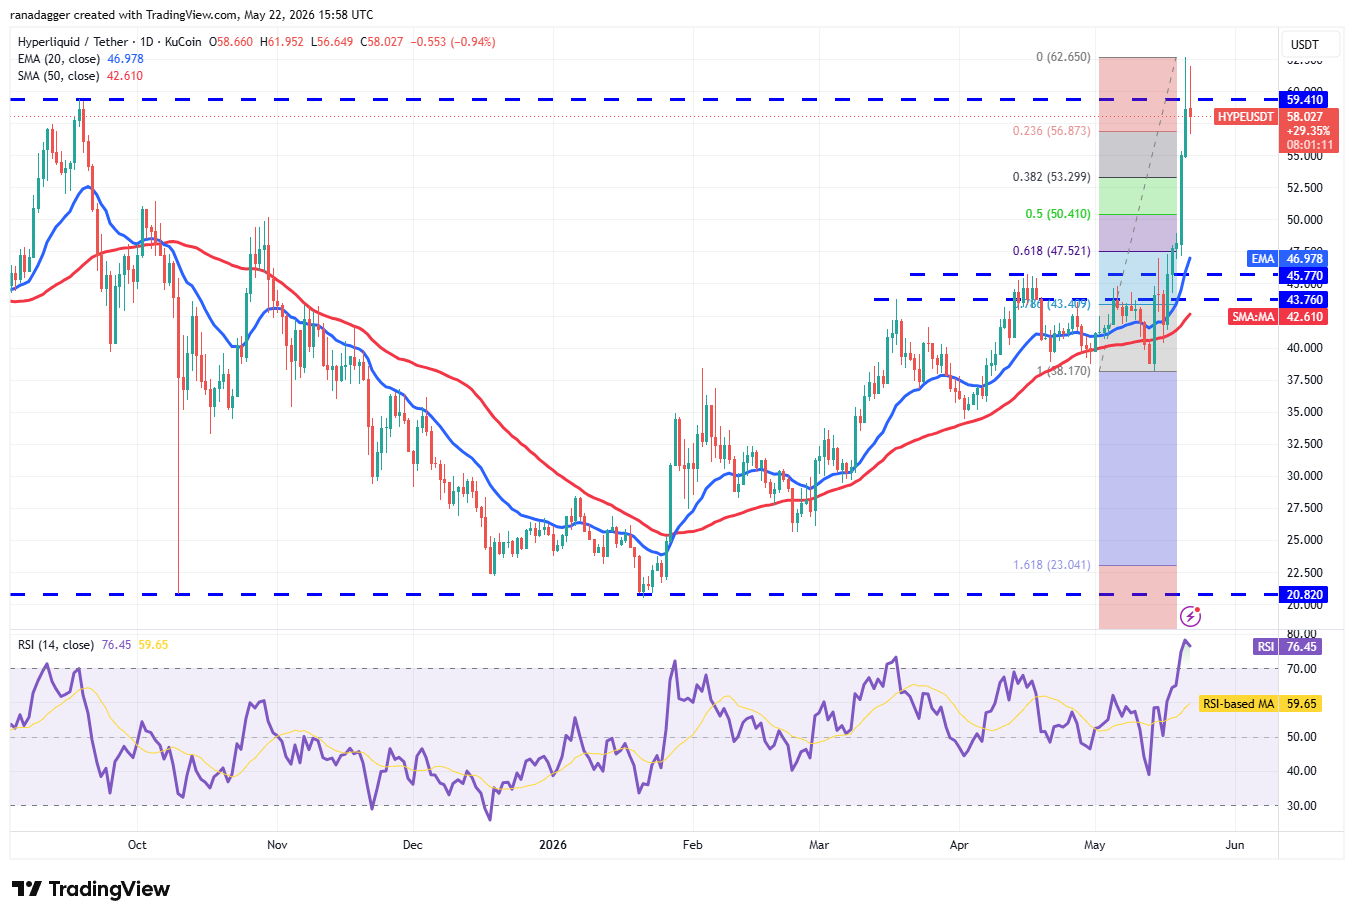
HYPE/USDT daily chart. Source: Cointelegraph/TradingView
Sellers are fiercely defending the $59.41 level, as they have not allowed the bulls to close above it. The first support on the downside is the 38.2% Fibonacci retracement level of $53.29. If the HYPE price rebounds off the $53.29 level with strength, the bulls will again attempt to resume the uptrend. A close above $62.65 opens the door to a rally toward $77.
Alternatively, a close below the $53.29 level suggests that the short-term traders are booking profits. The HYPE/USDT pair may then tumble to the 50% retracement level of $50.41 and then the 20-day EMA ($46.97). The deeper the fall, the longer the time needed for the resumption of the uptrend.
Related: XRP adds 4,300 new wallets in 24 hours, but why is price stuck?
Cardano price prediction
Cardano (ADA) has been trading just below its moving averages, suggesting the bulls have not given up.
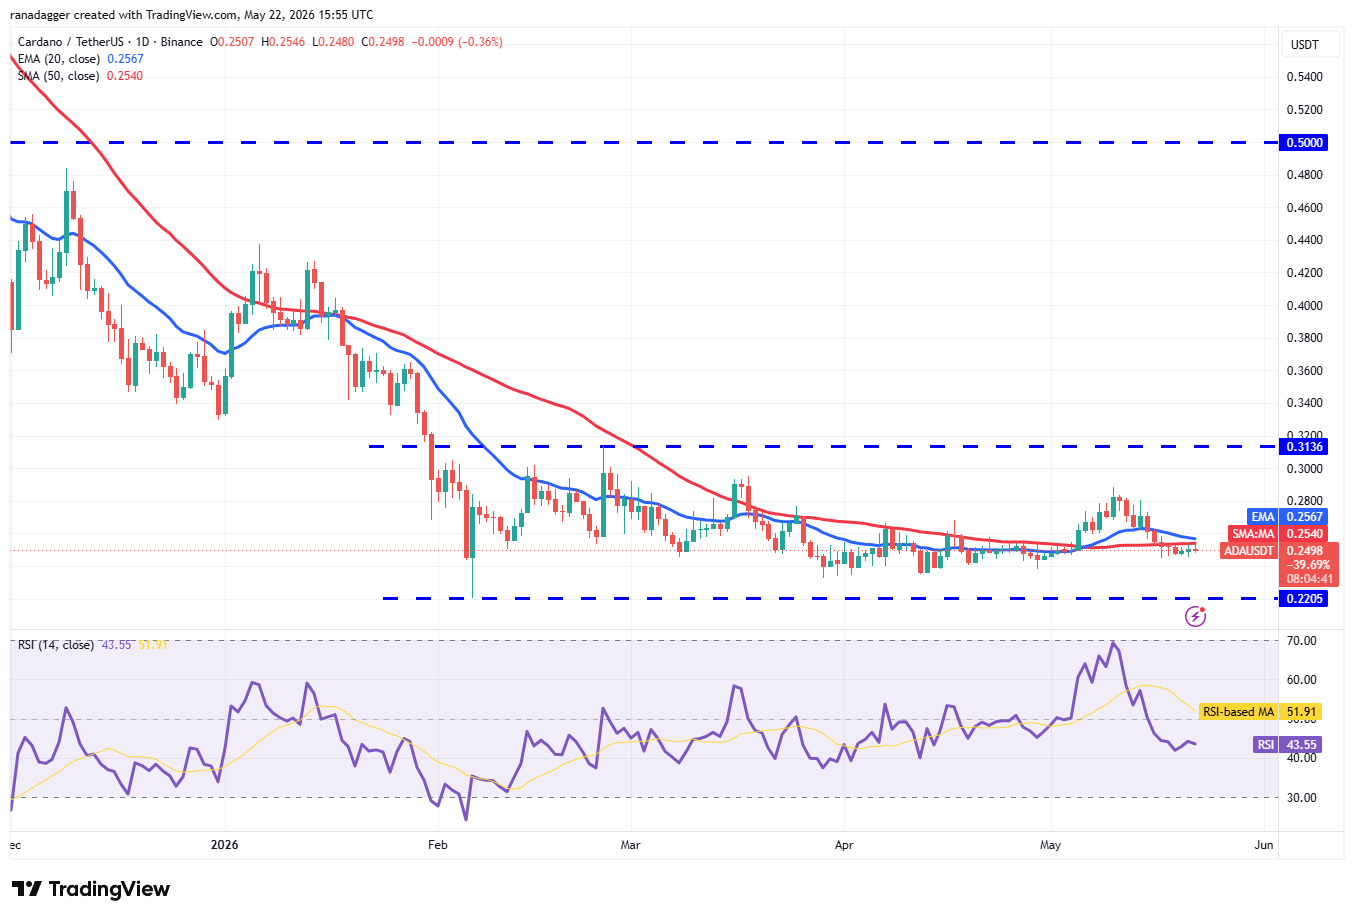
ADA/USDT daily chart. Source: Cointelegraph/TradingView
A break and close above the 20-day EMA ($0.25) opens the doors for a recovery to $0.29 and, after that, to $0.31. Buyers will have to clear the $0.31 hurdle to signal the start of a new up move.
Instead, if the ADA price turns down from the moving averages, it suggests that the bears remain in control. There is support at $0.24, but if the level breaks down, the ADA/USDT pair may slump to the bottom of the $0.22 to $0.31 range.
Zcash price prediction
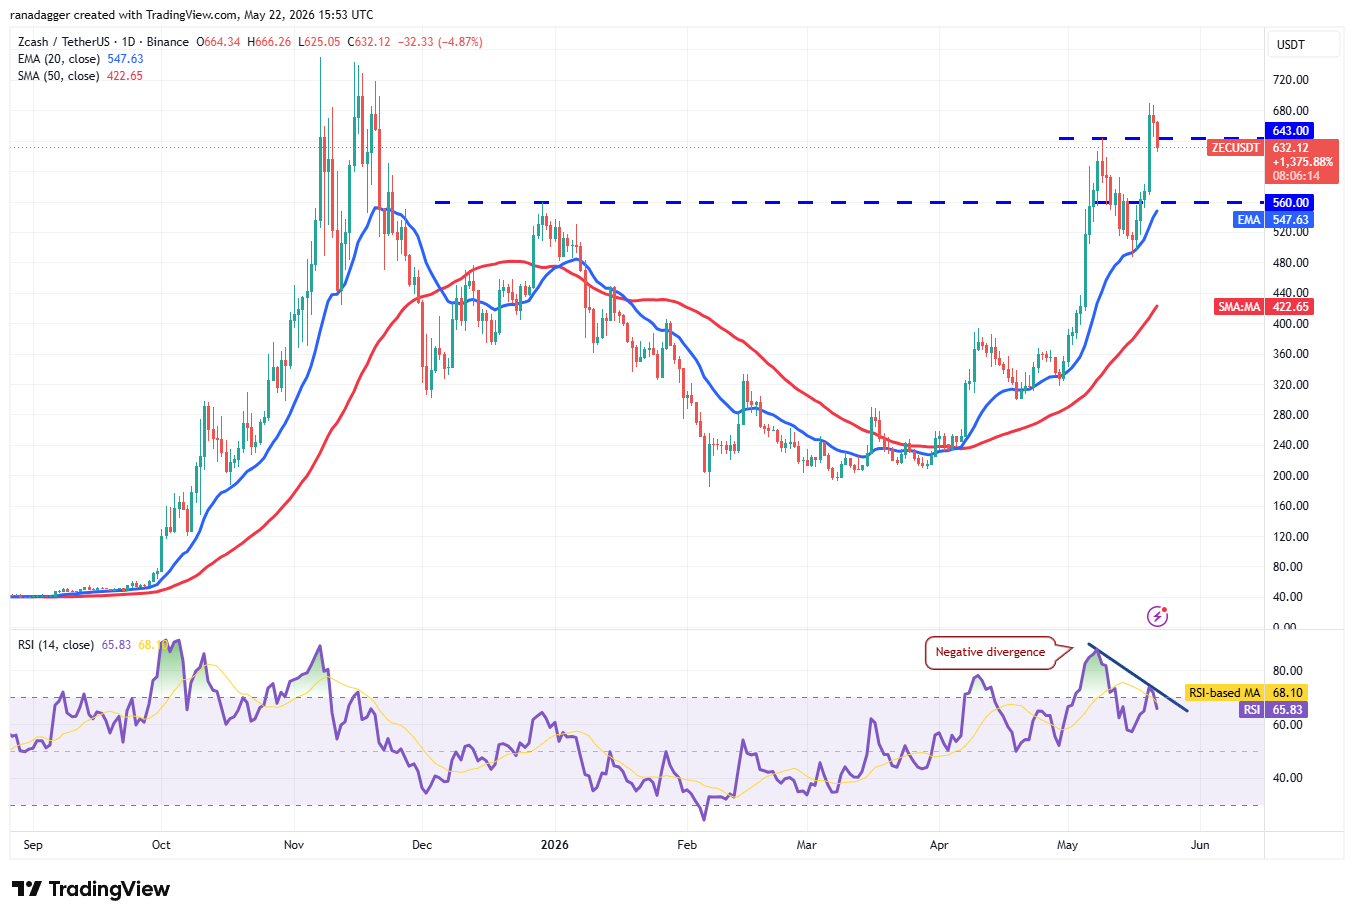
Zcash (ZEC) pole vaulted above the $643 resistance on Wednesday, but the bulls are struggling to sustain the higher levels.
ZEC/USDT daily chart. Source: Cointelegraph/TradingView
The relative strength index is forming a negative divergence, indicating that the bullish momentum is weakening. If the ZEC price closes below the $643 level, it signals the possibility of a deeper correction toward the 20-day EMA ($547).
If the ZEC/USDT pair turns up from the current level or the 20-day EMA, it indicates that the uptrend remains intact. The bulls will then make one more attempt to clear the $690 level, clearing the path for a rally to the $750 resistance.
Bitcoin Cash price prediction
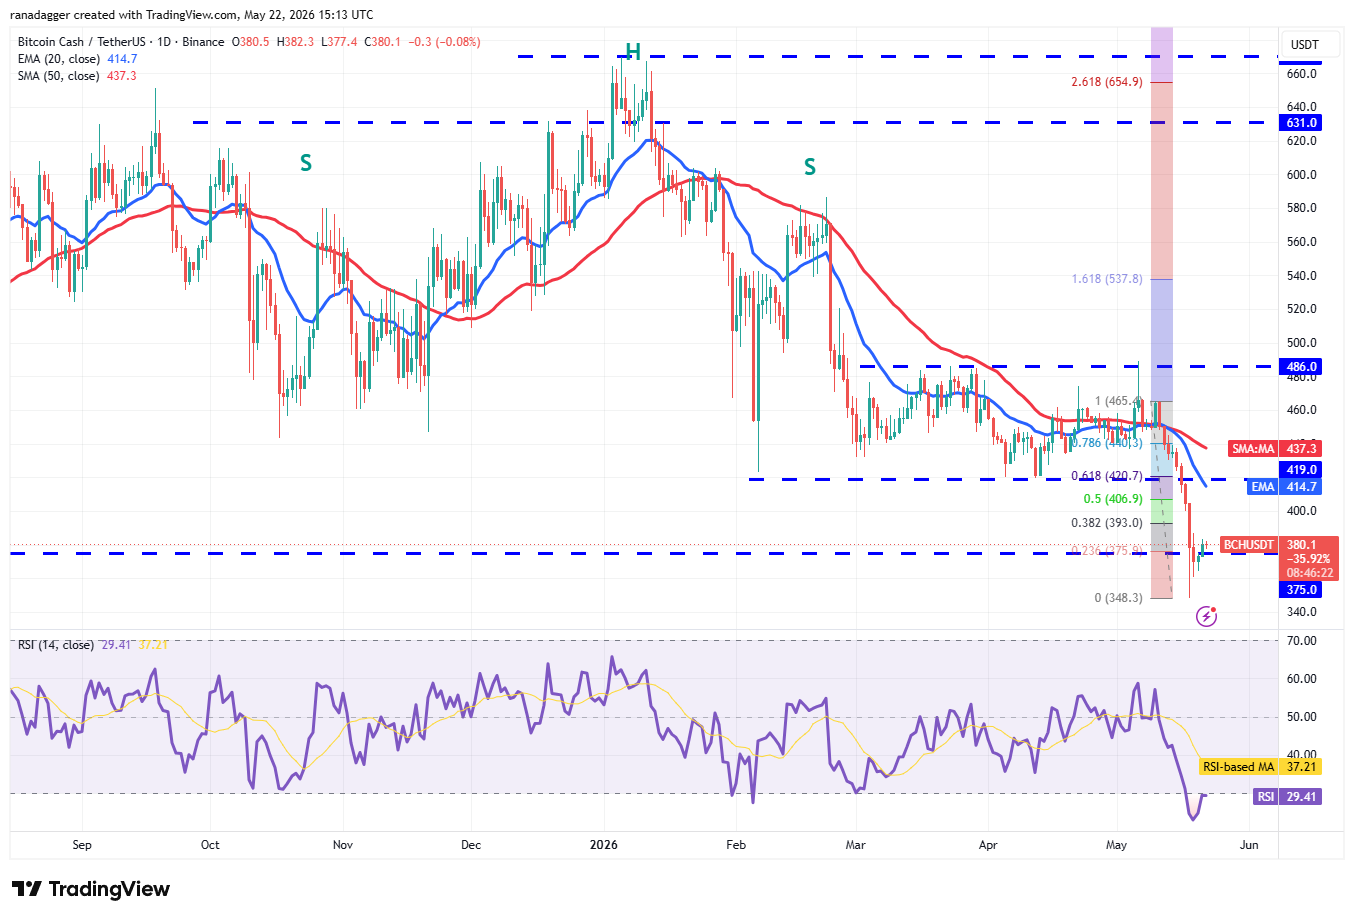
Bitcoin Cash (BCH) has risen above the breakdown level of $375, but the rebound lacks strength.
BCH/USDT daily chart. Source: Cointelegraph/TradingView
The relief rally is expected to face selling at the 38.2% Fibonacci retracement level of $393 and then at the 20-day EMA ($414). If BCH price declines from $393, the risk of a break below $348 increases. The BCH/USDT pair may then resume the downtrend and plunge to $300.
This negative view will be invalidated in the near term if buyers drive and maintain the price above the 20-day EMA.