




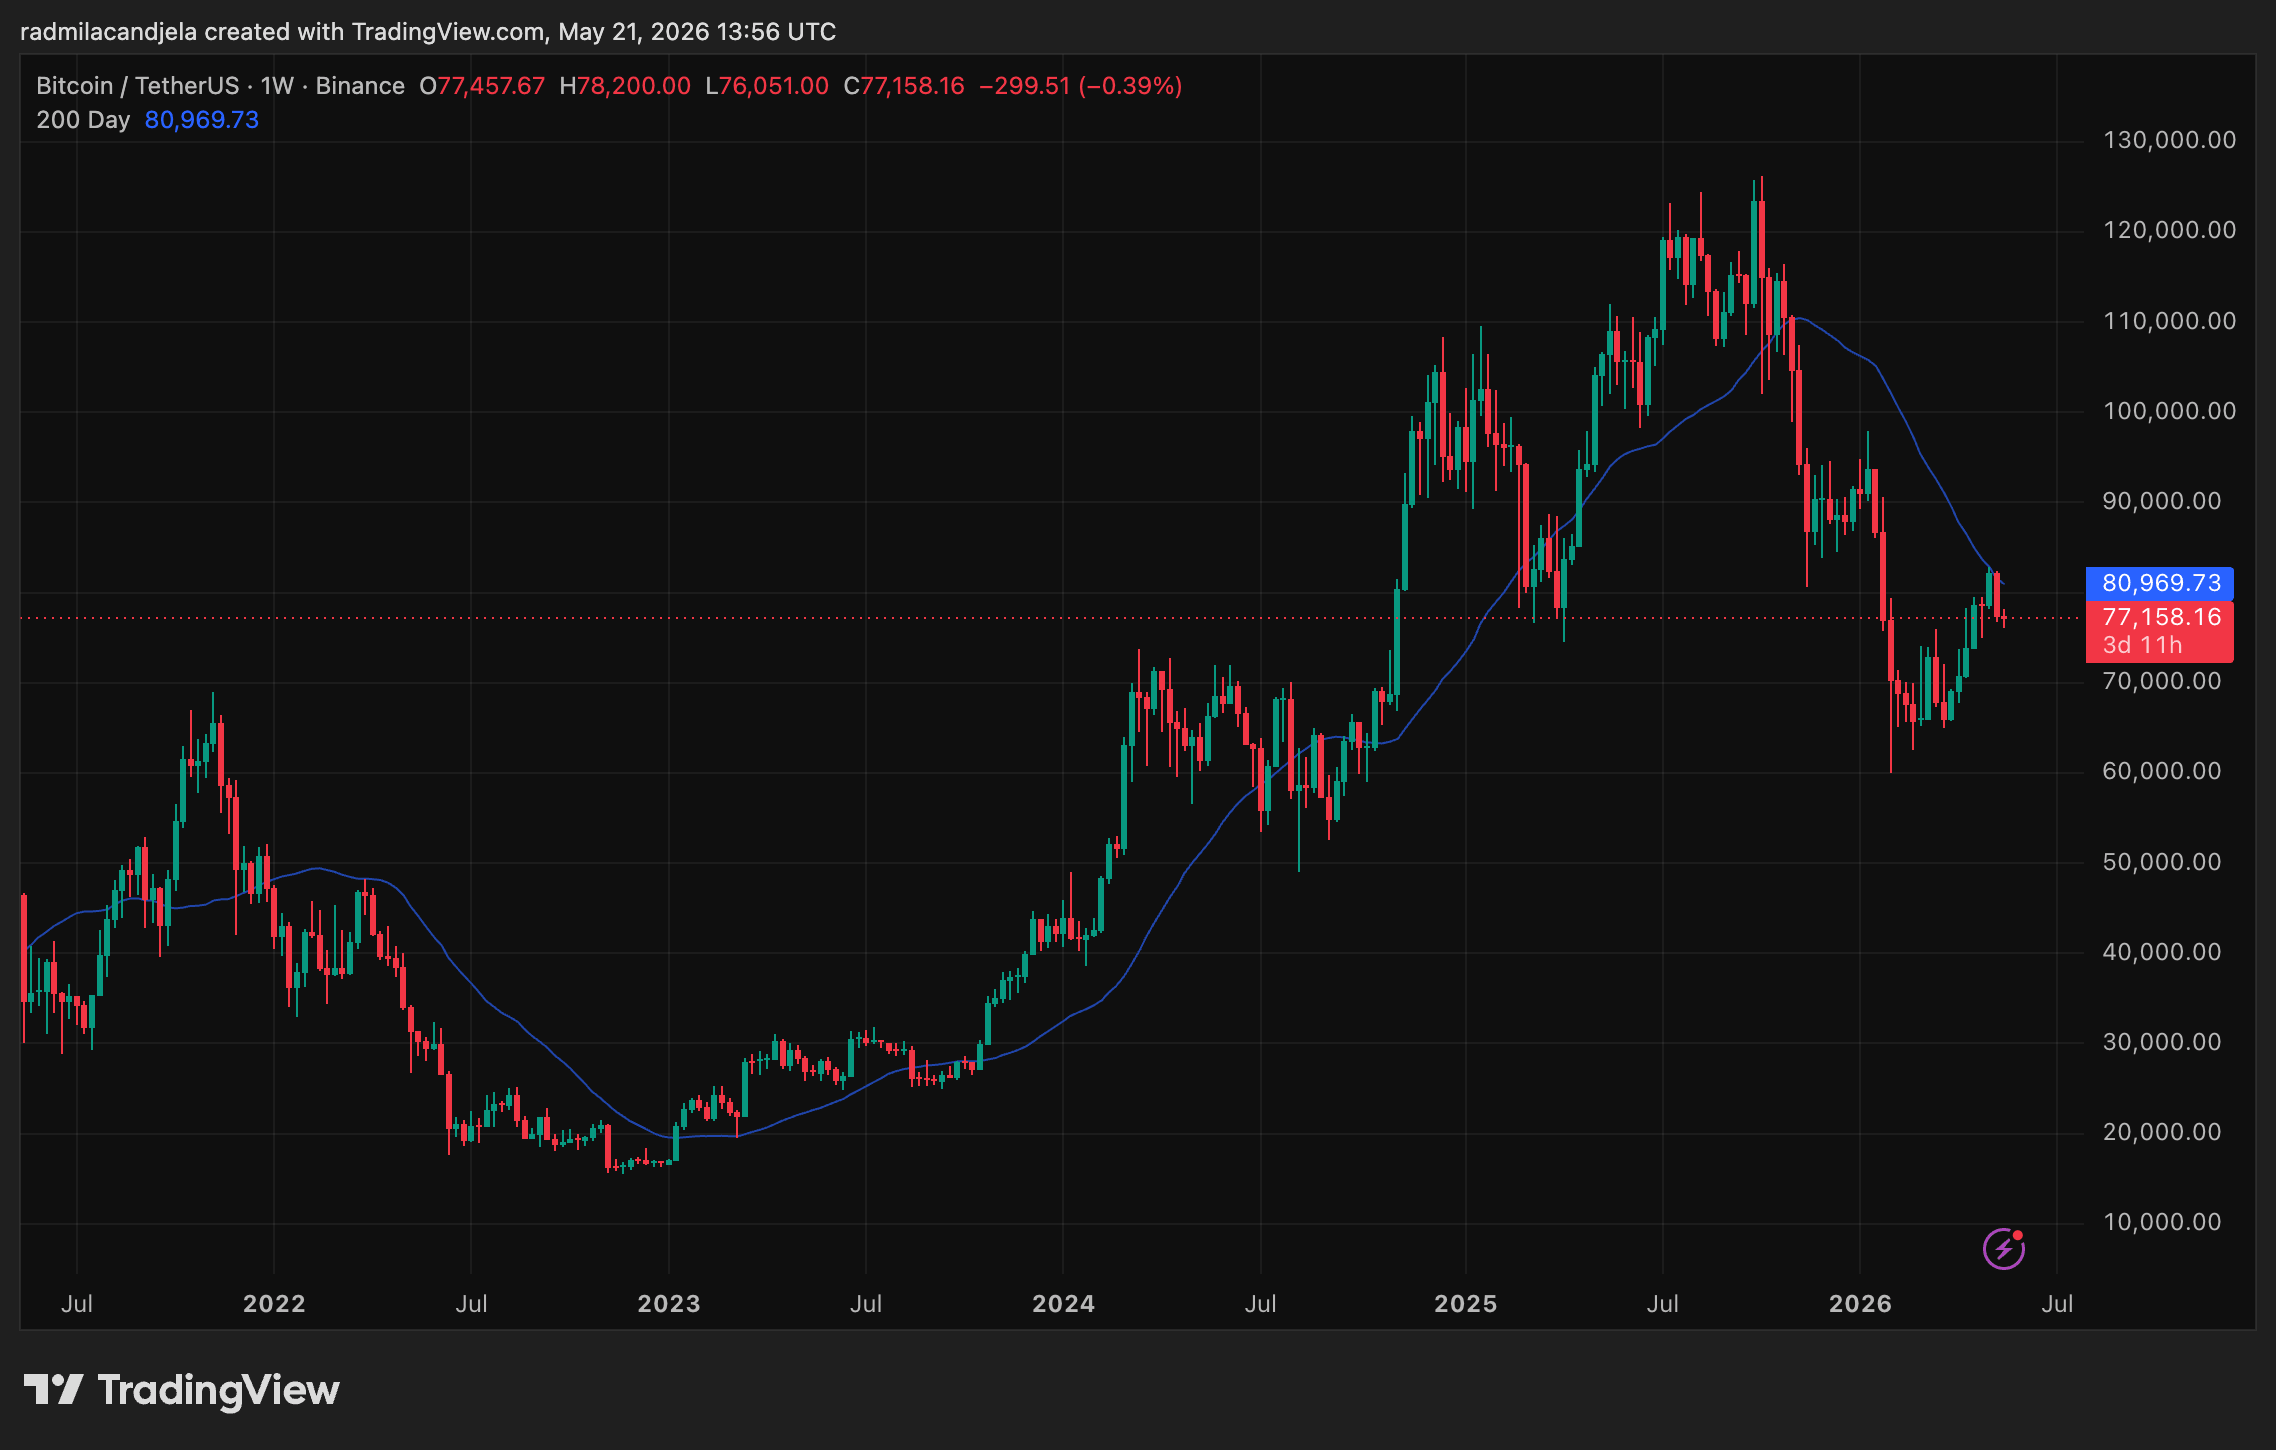
Bitcoin price reached $82,400 on May 20 and ran into a line on a chart. Up 37% from its April lows, BTC stalled at the 200-day moving average, pulled back to as low as $76,000, and left the market wondering what the rejection showed about the market’s underlying structure.
That line, a simple arithmetic average, is among the most-watched indicators in crypto, and understanding why helps decode how the market is reading the current moment.
The reversal repeated a pattern we saw in March 2022, when Bitcoin staged a comparable 43% relief rally before testing the same indicator and resuming its downtrend. That parallel deserves careful attention, though the current on-chain data adds important nuance.
The math behind the price anxiety
A moving average smooths price volatility by averaging a set of historical prices into a single line. The 200-day version takes Bitcoin’s daily closing prices over the previous 200 “sessions,” averages them, and plots the result continuously, updating each day as the oldest price drops out and the newest enters. It’s one of the most straightforward indicators in technical analysis, with the 200-bar version widely used as a proxy for longer-term trend direction.

The 200-day figure comes from traditional equity markets, where roughly 200 trading sessions cover close to 40 weeks of activity. Bitcoin trades every hour of every day, so the “200 days” here is literally 200 calendar days rather than 200 exchange sessions.
The average filters out noise first: Bitcoin can swing 10% in a single session, and the 200-day absorbs that daily turbulence into something that can be called a trend. CryptoSlate has tracked this across multiple market cycles, noting that Bitcoin’s historical interaction with the 200-day SMA has reliably reflected bullish and bearish regimes.
However, it also acts as a crowd checkpoint: because so many different market participants reference the same level simultaneously, it tends to function as a self-fulfilling structural boundary, acting as support when price is above and resistance when price is below.
The 200-day also offers something Bitcoin seems to lack elsewhere: a clean, simple signal. Bitcoin doesn’t come with earnings reports or a dividend calendar, which leaves traders leaning on on-chain data. Everything above the 200-day is considered bullish, and anything below is bearish, and a rejection at the line is seen as a confirmation that the market’s longer-term structure remains weak.
What Bitcoin’s ceiling tells us about its floor
Given the size and scope of the Bitcoin market, there are dozens of factors at play that contributed to this reversal. CryptoQuant research identified simultaneous deterioration across three demand components at the moment of the rejection: perpetual futures positioning reversed sharply as prices hit $82,000, spot apparent demand contracted faster than in prior weeks, and ETFs turned net sellers, with their 30-day demand growth falling to its lowest level in nearly a month.
CryptoSlate reported that the market saw over $1 billion in outflows from digital asset investment products in the week ending May 20, the first negative week in seven, with Bitcoin products accounting for $982 million of that total. The week before had already recorded another $1 billion withdrawal, snapping a six-week streak of consecutive positive inflows and unwinding roughly 14,000 Bitcoin in net outflows.
Two consecutive weeks of significant institutional selling, arriving just as Bitcoin tested its key resistance, didn’t fare well. The Coinbase premium stayed persistently negative throughout the April-May rally, confirming that US institutional demand didn’t re-engage at scale during the recovery attempt we saw in the past couple of months. Historically, sustained Bitcoin advances have required a positive Coinbase premium as a baseline condition, and its absence tells us the move was driven primarily by global speculative futures activity rather than domestic accumulation.
The CryptoQuant Bull Score Index fell from 40 back to 20 following the rejection, matching the extreme bearish readings of February-March 2026, when Bitcoin declined to the $60,000-$66,000 range. CryptoSlate has previously identified trend reclamation, demand inflection, and risk appetite normalization as the three preconditions for a genuine bear market exit, and the current situation is weak across all three simultaneously.
But it’s important to remember that the 200-day moving average is a warning light, not a steering wheel.
The 2026 setup is different from the one we saw in 2022: the 200-day MA is trending lower this cycle rather than higher, suggesting the historical parallel carries real limits. If the correction continues, CryptoQuant identified the on-chain realized price of approximately $70,000 as the primary on-chain support target, a break-even level where selling pressure has historically diminished.
Earlier CryptoSlate analysis tracked the same data during the February drawdown, pointing to the convergence of moving averages and realized prices as structural anchors for any recovery thesis.
The paradox embedded in all of this is worth sitting with: one of the most consequential signals in crypto is, at its core, just an average. When enough participants treat the same level as a structural checkpoint, that simple math becomes considerably more powerful than it really is. The 200-day MA is a shared test of market conviction, and right now, that conviction is failing.
